
Have you explored the use of formative assessment to improve your pedagogy? The goal of formative assessment is to inform teaching and learning, helping to refine instructional practice by teachers and improve understanding by students. Formative assessment is an iterative process that may lead to discovery of new ideas. Many types of formative assessment methods guided invaluable improvements to pedagogical tools consisting of a suite of visualizations introducing fundamental database concepts to students across many disciplines. Reflections on the experience examine the impact of the analyzed feedback on both the visualizations as well as teaching practice.
Introduction
Formative assessment is an ongoing process that informs next steps in refining instruction by teachers and improves student understanding. There are many different approaches used for formative assessment, including surveys, observations, student self-evaluations, and the analysis of student work. Some techniques are informal whereas others are somewhat more complicated. This paper reflects on the expected practice of gathering assessment data and its subsequent evaluation for improving pedagogy. Yet, this iterative process of the application of formative assessment can yield substantial improvements that perhaps were unexpected.
Over the past decade, the objective of the Databases for Many Majors project [7] is to provide engaging visualizations for students of all majors to understand the fundamental concepts of databases. Through the assessment of the various facets of the project, the educators discovered the power of formative assessment. In fact, the project's development was substantially guided by the various formative assessments conducted during that time. The goal of this paper is to illustrate how the application of various formative assessment techniques guided improvements to the pedagogy of database visualizations and to motivate the use of this methodology by educators to refine their own pedagogy.
After providing an overview of formative assessment, the paper provides a brief overview of the visualizations and describes the practice of applying these approaches to the visualization pedagogy. Specifically, the use of conversational assessments, which include surveys and communications, had a significant impact on the project. Qualitative content analysis, a data reduction technique, applied to open-ended responses obtained from surveys led to the discovery of feedback that shaped specific improvements to the visualizations. In addition, a formal conversation via a survey was also performed to gather formative feedback from instructors. An item analysis of a summative knowledge assessment provided insight into student understanding and common misconceptions, as well as informed revisions for the wording on some of these questions. The questions from this knowledge assessment formed the foundation of the comprehensive formative self-assessment incorporated into the visualizations. A reflective discussion of these various applications of formative assessment for the project leads to implications of how to incorporate some of these techniques to improve teaching.
Overview of Formative Assessment
The goal of formative assessment is to inform learning, helping to refine instructional practice by teachers and improve understanding by students [5]. Formative assessment provides information about what students understand. This knowledge guides the immediate next steps for instruction and empowers students to take a more active role in their learning. The framework in [16] identifies four broad categories of formative assessment: observations, conversations, self-evaluations, and artifacts of learning. As educators, we are probably using several of these formative assessment categories daily without necessarily realizing it.
Observations are notes on how students are responding to the learning in class. What questions are students asking as you walk around the room to facilitate the in-class exercise? Are students frustrated or bored with the in-class exercise? How many students are completing the exercise before the end of class? These observations provide essential information to refine your teaching.
Conversations can be formal or informal. A survey posted on a content management system after a topic or end of semester is considered a conversation. An informal conversation may be an oral poll of the class on a targeted question or discussions during your office hours. In cooperative learning [11] the +/Δ post-it notes are also conversations, indicating something the student learned that day and a question that they still have. Another type of conversation is asking students for questions when reviewing for a summative assessment. Encourage students to put a question on the white board via post-it notes so that they can anonymously pose their uncertainty on a topic.
Self-evaluations are an important component of formative assessment that provide opportunities for students to reflect on their learning progress. 'Self-evaluations encourage students to monitor their own learning and learning needs.' [16] In educational theory, this goal is supported by the MUSIC Model of Academic Motivation [12], which stands for eMpowerment, Usefulness, Success, Interest, and Caring for instructional design. 'Empowerment refers to the amount of perceived control that students have over their learning.' [12] Another formative assessment technique that is both a self-evaluation and a conversation is a post-exam questionnaire [1], also known as an exam wrapper [14]. This questionnaire provides both a reflection opportunity for students on how they prepared for the exam and what they would change for the next exam as well as a component to provide feedback to the instructional team to support their learning.
The artifacts of learning category refers to the analysis of student work, such as exercises, homework, tests, and quizzes to gain knowledge about their progress. For example, recording the students score on each question on a quiz or exam can provide information on student strengths and weaknesses. In active or cooperative learning [11], student groups are given an exercise to put the concept just covered in action by applying that knowledge to solve a problem. If class time permits, have the students present the answer for a class discussion. Otherwise, collect a recorded answer from each group and provide written feedback to the group by the start of the next class. This feedback is not a grade with a number but an opportunity to provide feedback to improve learning.
The examples above probably illustrated many techniques of formative assessment that you are already using in your classes. There are many ideas for formative assessment for college teachers provided in [2] with concrete examples provided across many disciplines. Several types of formative assessment influenced the development of the database visualizations used as a case study in this paper.
Database Visualizations
Over the past decade, the objective of the Databases for Many Majors project [7] is to provide engaging visualizations for students of all majors to understand the fundamental concepts of databases. Through the assessment of the various facets of the project, the educators discovered the power of formative assessment. Three visualizations are available: IntroDB, QueryDB, DesignDB. IntroDB introduces students to relational databases by illustrating limitations of spreadsheets and how databases break down concepts into tables without redundancy. Primary and foreign keys combine the table data when needed to answer a query. QueryDB illustrates the necessary operations for data manipulation and then introduces the SQL industry standard query language in a visual manner. DesignDB focuses on the conceptual design of databases, representing the concepts and relationships between these concepts visually. This design is then mapped to a collection of relational tables. These visualizations use cueing and color to present their story to the student. An important component of each of the visualizations is a formative self-assessment feature, called a checkpoint, based on a database analogy. There are twenty questions, consisting of mostly multiple-choice questions and some true/false, for students to test their understanding of the knowledge. Another important feature of the visualizations is that the content of the data example, supporting text, and self-assessment questions are customizable. Instructors can customize the story to the content of their class to introduce these fundamental database concepts in context. The project's website [7] has several customizations in various disciplines available for use by instructors, including Computational Molecular Biology, Neuroinformatics, Environmental Science, Geographic Information Systems, Forensics, Sports Statistics, and Astronomy.
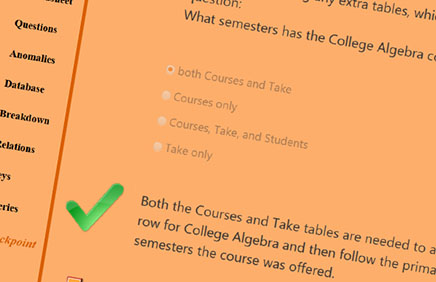
The visualizations are written in a general-purpose programming language to support the customizability of the visualizations. Figure 1 provides a screenshot of the IntroDB visualization for the default example of students taking courses. The left-hand side shows the succession of topics in the visualization. The bottom slider shows the subtopics within the selected topic where the labelled tick marks represent discrete conceptual steps within the story that the viewer can select to start replay. Figure 1 illustrates how different colors and shapes provide cueing to the viewer. In this specific screenshot illustrating the relationship between primary and foreign keys, the viewer selected the orange foreign key next to CrsID in Take within the Keys topic and the Review subtopic. The visualization highlights the foreign key values in orange and at the same time, highlights the corresponding primary key values in yellow-gold to illustrate referential integrity, requiring that a CrsID value in Take must be one of the CrsID values in Courses. Figure 2 displays an example of a checkpoint question from that same visualization, identifying tables needed to answer a query. The checkpoint randomizes the questions to be answered as well as the question choices. The textual feedback on answering a question is always provided to the student along with a visual cue of a green checkmark or a red X to indicate whether the student's answer choice is correct. The exclamation mark indicates the topic to review on the left-hand side. The progress bar visually shows the student's progress within the checkpoint, including an additional textual label below the bar.
Informal Conversations
As educators, we often ask students for feedback, either through a quick clicker question or a brief informal survey, perhaps after the completion of a chapter or at the end of the semester. Some questions may be targeting a new type of exercise used in the class or be open-ended. Sometimes students offer their feedback during office hours in a more informal setting. It was some of these informal conversations that had a significant impact on the Databases for Many Majors project.
The initial versions of the visualizations did not contain a formative self-assessment feature. This feature was added after receiving informal feedback from students being introduced to database concepts as a computer science concept in CS1. The IntroDB visualization was assigned outside of class in a flipped classroom style with twenty questions posted on the content management system for students to answer for participation credit.
Students were surprised that they did not do as well on the questions because they thought that they understood the concepts in the visualizations. This overconfidence is not uncommon in the context of visualizations [3]. The questions posted on the content management system were based off the pre/post-tests in the assessment reported in [9], and refinements to these questions formed the basis of the checkpoint questions added to the visualizations. Once the formative self-assessment component was added, feedback indicated that the checkpoints were definitely helpful for understanding [8].
Additional informal conversations led to feedback from students indicating issues with the accessibility of some of the features of the visualizations for those having color vision deficiency (CVD), more commonly known as color blindness. Research into tools and techniques for improving the accessibility of the visualizations resulted in changes that provided more contrast and used additional cues besides color to convey an idea [4].
Coding of Open-Ended Questions
When using a survey with your students to get feedback, have you formally analyzed the comments in the open-ended questions? By taking a closer look at the text, you may uncover something unexpected and useful. For example, a recent analysis of student evaluation comments changed a full demonstration of technology to a mini demonstration with skeletal notes for students to complete the exercise as active participants in the learning process. One formal approach for the analysis of textual content is called qualitative content analysis.
Qualitative content analysis is a research technique that analyzes the content of text, reducing the data into content categories [18,20]. Using categories derived from reviewing the textual data is known as data-driven or emergent coding. Multiple people independently review the data and establish initial categories, which are reviewed, and differences reconciled before coding the data based on this reconciled list of categories. The coding is also done independently and reviewed for acceptable reliability. Note that within the categories, subcategories can be introduced to capture additional information. The counts within each category display an overall view of the reduced data. And note that when coding text, it may be coded into multiple categories based on its content. Qualitative content analysis was used several times over the project's lifetime.
In our study presented in [9], the open-ended questions for formative feedback were coded using qualitative content analysis into three main categories: Helpful, Not as Helpful, and Improvements Needed. Students found the visualizations helpful for their dynamic presentation with interactive replay capability and its repeatability for reviewing. Some students indicated that practicing was more helpful. There were improvements needed in the visualization for replay. This feedback resulted in a migration of the software to a framework that supported discrete steps within the visualization. These steps provide an overview of the visualization content and support replay at those conceptual points in the visualization. Incorporating segmentation based on topics into meaningful pieces is recommended for the development of visualizations [19].
Once the formative self-assessment questions were introduced, a qualitative code analysis of an open-ended question was performed on the checkpoint component of the visualizations [8]. Again, resulting categories were Helpful with subcategories on how it was helpful, along with Improvements Needed and Not as Helpful. The improvement needed for the checkpoint was the ability to view the supporting information for the checkpoint question within the checkpoint, without having to go back and forth to a location within the presentation details of the visualization. A Show button was added to each checkpoint question to pop up the necessary information for the student to answer the question.
After completing the visualization for designing databases, a study [10] was performed that included an open-ended question: 'Please provide feedback on the visualization and the checkpoint.' Resulting categories were Helpful with subcategories of Visual Learner, Studying, Different Mode, and Generic; and Caveats where some students had additional comments, e.g., 'Time consuming but effective.' Although this coding did not result in any improvements for the visualizations, it confirmed the student's perspective on the helpfulness of the visualization for learning how to design databases.
Formal Conversations
When introducing a new topic into your course, you probably have a more detailed survey that you give students on various aspects of the curriculum, such as course notes, exercises, and assignments. For the project, we asked instructors who customized the visualizations for their courses to participate in a more formal conversation with a detailed survey. Customization requires that the data example and its corresponding text along with the checkpoint questions be revised. Each visualization can be customized by calling it in customization mode. The visualization will stop and highlight changeable features. The customizers save the changes to a file, which is then submitted to a project leader for curation who verifies that the data satisfies the required constraints and that the learning objectives of each checkpoint question have been met.
The customizers were asked to respond to a formal survey for project formative assessment that consisted of various components. Specifically, the customizers were asked to record the amount of time that it took them: to view the visualizations and answer the checkpoint questions; to customize the visualization not including the checkpoint; and to customize the checkpoint itself. Any comments, questions, or issues as they were working on a component were also recorded. Finally, they were asked open-ended questions to provide feedback on the documentation, usefulness of tooltips, and strengths/weaknesses of the customization process.
The results of this survey illustrated several areas needing improvement.
- There were too many tedious name changes to make in each visualization.
- It was difficult to understand the constraints that had to hold on the data using the textual documentation.
- The query specifications in IntroDB and QueryDB were not general enough. (At the time of this survey, the queries had to be quite like the default student example, which was too constraining.)
- The most time-consuming parts of the customization included the determination of the database and the checkpoint questions.
- The checkpoint questions were difficult to answer without having support for viewing the tables or schema associated with the question.
- Some of the checkpoint questions seemed confusing based on their wording.
This formative feedback triggered immediate changes in the visualizations. First, the IntroDB and QueryDB query specifications were generalized. Then the Show Tables and Show Schema buttons were added to the checkpoints, since this feedback from customizers agreed with feedback from students that was uncovered by the qualitative content analysis of the open-ended questions posed to students after incorporation of the checkpoint.
To address the difficulty in understanding the data constraints in building the database structure and instance, the project developed a customization tool, called CreateDB. CreateDB assists customizers with entering their data and verifying the various constraints incrementally as they are building their example. Once the valid data instance is created in the tool, it supports the generation of the template files for customizing IntroDB, QueryDB, and DesignDB. This generation process is a global case sensitive Find and Replace of the table and attribute names in the template files to remove the tedious name changes for the customizer. Since the context of the example has changed, they still must read through and modify the textual descriptions as necessary to support the description of their domain-specific example.
The DesignDB visualization was under development at the time of this survey. Understanding that the customizations of the 20 checkpoint questions was most of the customization time, the project leaders developed a generic conceptual design checkpoint that did not require customization. Customizers are still able to customize the checkpoint questions if they want. Thus, the required customization for DesignDB was substantially reduced.
The confusing wording of some of the checkpoint questions led to an analysis of the post-test summative knowledge assessment that formed the foundation of the checkpoint questions, which is discussed in the next section.
Item Analysis
As instructors, we informally analyze student work as we prepare and teach our classes. We examine the clicker responses to see whether the students are understanding the concepts. Before discussing the feedback on an assignment, we review the most common mistakes to address these issues during the class. For multiple choice questions, there is a more formal approach available to analyze student responses, which is known as item analysis. In fact, most content management systems provide this feature for viewing assessment statistics.
In general, an item analysis examines student responses to individual questions in order to assess the quality of the questions and of the assessment as a whole [17]. There are multiple components to item analysis. There are three key components introduced as follow.
- Item Discrimination provides feedback on the consistency and quality of the questions. A high-quality item is one where a "good" student (defined as a student who did well overall) answers the question correctly. Formally, item discrimination is ability of an item, or question, to differentiate among students based on how well they know the material being tested. This is commonly measured by the point biserial correlation, which is essentially the correlation between the item and the raw test score [6]. Typically, a positive biserial correlation indicates a high-quality question. This is a question where "good" students get the question correct more often than students who do poorly overall. A question with a point-biserial coefficient of approximately 0 would not provide useful feedback or information on student learning. Finally, a question with a negative point-biserial coefficient should be reviewed since it often indicates a mistake in the wording or answer key.
- Item Difficulty is the percentage of students who correctly answer the question. The analysis of the item difficulty provides feedback about the level of understanding for the various topics.
- Distractor Analysis identifies commonly selected incorrect answers, known as distractors. The identification of distractors provides insights into common misconceptions in student learning or misleading wording of answer choices.
The project team wanted to investigate the student feedback that some of the checkpoint questions were confusing, but the visualizations are executed on a student's local machine and the actual choices are not recorded. However, the comprehensive checkpoint questions are based on the multiple-choice post-test data of the initial summative evaluation of the learning outcomes for IntroDB and QueryDB, which illustrated that the visualizations improved student knowledge of fundamental database concepts [9]. Therefore, an item analysis of the multiple-choice post-test data of the study was performed to look for confusing wording on some of the checkpoint questions.
Tables 1 and 2 provide the details of the item analysis for the post-test data gathered for IntroDB and QueryDB, respectively. The difficulty of each question and its biserial correlation value are shown in the tables. The categorization of the questions within topics [9] and noted skill are also included in the tables, illustrating the comprehensiveness of the post-test questions, which were designed to cover the learning outcomes associated with each visualization. The goal of including these additional details is to inform educators who may want to include these visualization tools within their courses so that they can design active learning pedagogy to address the concepts that students find more challenging.
The item discrimination analysis of both visualizations indicates that most of the questions in the assessment and associated checkpoints are 'good items,' [6] based on the biserial correlation value greater than 0.30. There are questions that all students answered correctly. Since the objective of the post-test was to be comprehensive of the learning outcomes of the visualizations, this is acceptable. However, if you are designing a multiple-choice assessment for your class, these questions are obviously too easy and should be revised. In fact, the difficulty analysis revealed that students do quite well on the IntroDB topics, with anomalies and foreign keys being the more problematic topics. In general, the QueryDB visualization is introducing more difficult concepts, with students performing better on the identification of the correct SQL query for answering a given query. The questions that required rewording were in the Spreadsheet Anomalies topics, and specifically the Delete and Insert questions that were the most difficult. This was identified through a distractor analysis in conjunction with feedback from the instructors.
Reflections
The process of designing, implementing, and improving the visualizations over time was an iterative process. Many of the features incorporated into the current implementation of the visualizations are a direct result of project formative assessment to inform teaching: checkpoints with show features and improved wording, a customization tool, as well as the improved accessibility for those with color vision deficiency. Figure 3 shows a timeline summarizing the changes incorporated into the visualization pedagogy based on the guidance of the formative assessment techniques discussed in this paper. Most changes were guided by information obtained from students either from informal conversations, surveys, or posttests. The open-ended questions on the surveys were analyzed using qualitative content analysis and an item analysis of the post tests indicated necessary updates to the wordings of some of the checkpoint questions. Formal conversations with teachers who had customized the visualizations to contextualize the database coverage led to the development of a tool to assist instructors with creating the database for the visualization. Our experience has shown that formative assessment was critical to improving the visualizations and its customization process.
One of the goals of this paper is to motivate the use of several formative assessment techniques to inform teaching. … After introducing formative self-assessment into the visualizations, some of the authors have substantially enhanced this self-evaluation activity within their normal classroom practice.
One of the goals of this paper is to motivate the use of several formative assessment techniques to inform teaching. Some of the authors were introduced to both qualitative content analysis and item analysis by personnel whose goal was to formally assess the project results. Qualitative content analysis on open-ended survey responses informed many directions for improvements to the visualizations. The item analysis of the post-test questions reinforced the conversational assessment results that indicated wording improvements were warranted on some of the checkpoint questions. Both techniques can be incorporated into improving teaching by coding open-ended survey questions at the end of the semester and performing an item analysis on exam questions. Some content management systems provide the capability to generate the item analysis for evaluation by the instructor for online assessments.
After introducing formative self-assessment into the visualizations, some of the authors have substantially enhanced this self-evaluation activity within their normal classroom practice. Formative self-assessment opportunities before each quiz or exam are provided by posting multiple choice questions on the content management system. Although formative assessment is not usually graded, to encourage participation by students, a performance goal of 70% achieved 24 hours before the summative assessment will earn extra credit points on that quiz or exam. Setting a performance goal is recommended by several researchers [13,15]. The deadline is imposed to give students the opportunity to see the answers and ask any questions they may have before the summative assessment.
Consider enhancing your use of formative assessment for improving your teaching. The review of formative assessment in [5] shows 'that attention to formative assessment can lead to significant learning gains.'
• Acknowledgements
Many thanks to the reviewers, whose invaluable feedback helped to refine the paper. This work was supported in part by the National Science Foundation under Grant DUE-1431848, DUE-1431661, DUE-0941584, DUE-0941401. Any opinions, findings, and conclusions or recommendations expressed in this material are those of the author(s) and do not necessarily reflect the views of the National Science Foundation.
References
1. Achacoso, M.V. Post-test analysis: A tool for developing students' metacognitive awareness and self-regulation. New Directions for Teaching and Learning, (2004), 115–119; https://doi.org/10.1002/tl.179.
2. Angelo, T.A. and Cross, K.P. Classroom Assessment Techniques: A Handbook for College Teachers (2nd Ed.). (San Francisco, Jossey-Bass, 1993).
3. Awan, R. N., and Stevens, B. Static/Animated Diagrams and their Effect on Students Perceptions of Conceptual Understanding in Computer Aided Learning (CAL) Environments. In Proceedings Human Computer Interaction (2005), 381–389.
4. Bingham, R., Dietrich, S. W. and Goelman, D. Strategies to improve accessibility for learners with color vision deficiency. ACM Inroads, 10, 1 (2019), 52–56. https://doi.org/10.1145/3306140.
5. Black, P. and Wiliam, D. Assessment and Classroom Learning. Assessment in Education: Principles, Policy & Practice 5, 1 (1998), 7–74.
6. Cody, R. and Smith, J. Test Scoring and Analysis Using SAS. (Cary, NC, SAS Institute Inc., 2014).
7. Dietrich, S. W. and Goelman, D. Databases for Many Majors; http://databasesmanymajors.faculty.asu.edu/. Accessed, 2020 October 19.
8. Dietrich, S. W. and Goelman, D. Formative Self-Assessment for Customizable Database Visualizations: Checkpoints for Learning. Paper presented at 2017 ASEE Annual Conference & Exposition, Columbus, Ohio, Jun 2017; https://peer.asee.org/27853. Accessed, 2020 October 29.
9. Dietrich, S. W., Goelman, D., Borror, C. M., and Crook, S. M. An Animated Introduction to Relational Databases for Many Majors. In IEEE Transactions on Education, 58, 2 (2015), 81–89; doi:10.1109/TE.2014.2326834.
10. Goelman, D. and Dietrich, S. W. A Visual Introduction to Conceptual Database Design for All. SIGCSE '18 Proceedings of the 49th ACM Technical Symposium on Computer Science Education, (Baltimore, MD, 2018), 320–325; https://doi.org/10.1145/3159450.3159555.
11. Johnson, D.W., Johnson, R.T. and Smith, K.A. Active Learning: Cooperation in the College Classroom. (Interaction Book Company, 1991).
12. Jones, B.D. Motivating Students to Engage in Learning: The MUSIC Model of Academic Motivation. International Journal of Teaching and Learning in Higher Education 21 (2009), 272–285.
13. Koorsse, M., Olivier, W. and Greyling, J. Self-regulated Mobile Learning and Assessment: An Evaluation of Assessment Interfaces. Journal of Information Technology Education: Innovations in Practice 13, 5 (2014), 89–109; https://doi.org/10.28945/2087.
14. Lovett, M.C. Make exams worth more than the grade: Using exam wrappers to promote metacognition. In Kaplan, M., Silver, N., Lavaque-Manty, D. and Meizlish, D. Using reflection and metacognition to improve student learning, (Sterling, VA, Stylus Publishing, 2013), 18–52.
15. McMillan, J.H. and Hearn, J. Student self-assessment: the key to stronger student motivation and higher achievement. Educational Horizons 87, 1 (2008), 40–49.
16. National Council of Teachers of English. Formative Assessment that Truly Informs Instruction. 2013; https://secure.ncte.org/library/NCTEFiles/Resources/Positions/formative-assessment_single.pdf?_ga=2.208244498.1805811673.1589220227-999328425.1589220227. Accessed 2020 July 16.
17. Reynolds, C. R., Livingston, R. L. and Willson, V. Measurement and Assessment in Education. (Pearson/Allyn & Bacon, 2006).
18. Schreier, M. Qualitative Content Analysis in Practice. (SAGE Publications, 2012).
19. Spanjers, I., van Gog, T., Wouters, P. and van Merriënboer, J. Explaining the segmentation effect in learning from animations: The role of pausing and tempora cueing. Computers & Education 59 (2012), 274–280.
20. Stemler, S. An overview of content analysis. Practical Assessment, Research & Evaluation 7 no. 17 (2001).
Authors
Suzanne W. Dietrich
School of Mathematical and Natural Sciences, Arizona State University, USA
[email protected]
Don Goelman
Department of Computing Sciences, Villanova University, USA
[email protected]
Jennifer Broatch
School of Mathematical and Natural Sciences, Arizona State University, USA
[email protected]
Sharon M. Crook
School of Mathematical and Statistical Sciences, Arizona State University, USA
[email protected]
Becky Ball
School of Mathematical and Natural Sciences, Arizona State University, USA,
[email protected]
Kimberly Kobojek
School of Mathematical and Natural Sciences, Arizona State University, USA
[email protected]
Jennifer Ortiz
Paul G. Allen School of Computer Science and Engineering, University of Washington, USA
[email protected]
Figures
 Figure 1.
 Figure 2.
 Figure 3.
Tables
 Table 1. Introduction to Databases (IntroDB) Item Analysis
 Table 2. Querying Databases (QueryDB) Item Analysis
Copyright held by authors/owners. Publication rights licensed to ACM.
The Digital Library is published by the Association for Computing Machinery. Copyright © 2020 ACM, Inc.
Contents available inView Full Citation and Bibliometrics in the ACM DL.
To comment you must create or log in with your ACM account.
Comments
There are no comments at this time.